
The Geno 2 kit results can be divided into three areas: your maternal DNA (mtDNA); your paternal DNA (Y-DNA) and information from your entire genome (from both parents going back 6 generations according to the project blurb).
I have already done significant testing on my maternal and paternal lineages with Family Tree DNA (FTDNA) having already taken the mtDNA Full Sequence test and on my paternal side maxed out to 111 markers and obtained a terminal SNP (R-L165). Although I have taken the Family Finder test (as have both my parents) I was keen to learn what might be revealed further about my much deeper ancestry.
First of all I'll share something of my known ancestry for context. As far as I know all of my ancestors from documentary sources resided in Scotland. I have three ancestors who have caused me concern because they were either illegitimate or the documentary evidence was ambiguous.
My grandfather Macdonald was illegitimate, but I have proven beyond doubt his documentary lineage via Y-DNA testing and have a number of good Macdonald matches which can be seen in the R-L165 project at FTDNA (kit 46281).
My paternal grandmother Mary Innes was born in 1899, also in Caithness and as it happens was also illegitimate, her mother Emily Spence being only 15 years of age at the time. Emily would later marry Mary's supposed father George Innes and have a further nine children. My late father does has a first cousin and I know that if I could get him to take an autosomal test such as Family Finder (FTDNA) or Relative Finder (23andMe) then I could prove whether or not George Innes was indeed Mary's father as they ought to share approximately 12.5% DNA as first cousin. My grandmother and this chap’s mother were sisters.
Finally, Emily's father went by the name of Thomas Spence alias John Greenwood having joined the 1st Battalion/42nd Regiment the Black Watch sometime between August 1881 and June 1882. Further information regarding his parentage or origin has not yet been verified.
I know the names and supposed geographical origins of 57 or my 64 potential ancestors going back 6 generations. Here they are plotted on a map with blue being paternal and orange maternal.

As can be seen from the above image, my ancestors during the period 1760-1790 had a significant east coast bias.
A full description of the functionality to be found in the Genographic Project participant pages has been written by Roberta Estes in her excellent blogpost which is recommended reading, so I will not duplicate what she has provided.
First of all - WHO AM I?
The DNA I have inherited from both of my parents has been used in this section. My entire genome was compared to each of 43 reference populations in the current Genographic Project database. It was then estimated which of these populations was most similar to me in terms of the genetic markers I carry and my affiliations expressed as a percentage for each.
These 43 populations are then squeezed into 9 world regions: Northeast Asian; Mediterranean; Southern African; Southwest Asian; Native American; Oceanian; Southeast Asian; Northern European and Sub-Saharan African.
Information on the nine
regions from National Genographic:
Genographic state: Using a method of analysis that infers ancestral source populations, we have discovered nine ancestral regions that combine to make up everyone’s genome. Everyone has a mix of these components ranging from 0% to 100% due to interaction between these regions of the world over the past 50,000 years. Native Americans have their own group, as do Oceanians and the Khoisan people of southern Africa. In these places it is possible to have 100% of the respective region. Everyone else in the world is a mix of these components, reflecting ancient and modern migration patterns.
Genographic state: Using a method of analysis that infers ancestral source populations, we have discovered nine ancestral regions that combine to make up everyone’s genome. Everyone has a mix of these components ranging from 0% to 100% due to interaction between these regions of the world over the past 50,000 years. Native Americans have their own group, as do Oceanians and the Khoisan people of southern Africa. In these places it is possible to have 100% of the respective region. Everyone else in the world is a mix of these components, reflecting ancient and modern migration patterns.
As I have no known recent admixture I was not expecting any exotic component to be shown. Not surprisingly my first reference population region was British (United Kingdom) which consists of Northern European, Mediterranean and Southwest Asian.

Information on my British Reference Populations
British (United Kingdom)
This reference population is based on samples collected from populations in the United Kingdom. The dominant 50% northern European component likely reflects the earliest settlers in Europe, hunter-gatherers who arrived there more than 35,000 years ago. The 33% Mediterranean and 17% Southwest Asian percentages arrived later, with the spread of agriculture from the Fertile Crescent in the Middle East, over the past 10,000 years. As these early farmers moved into Europe, they spread their genetic patterns as well. Today, northern European populations retain their links to both the earliest Europeans and these later migrants from the Middle East.
Mediterranean
This component of your ancestry is found at highest frequencies in southern Europe and the Levant—people from Sardinia, Italy, Greece, Lebanon, Egypt and Tunisia in our reference populations. While not limited to these groups, it is found at lower frequencies throughout the rest of Europe, the Middle East, Central and South Asia. This component is likely the signal of the Neolithic population expansion from the Middle East, beginning around 8,000 years ago, likely from the western part of the Fertile Crescent.
Southwest Asian
This component of your ancestry is found at highest frequencies in India and neighboring populations, including Tajikistan and Iran in our reference dataset. It is also found at lower frequencies in Europe and North Africa. As with the Mediterranean component, it was likely spread during the Neolithic expansion, perhaps from the eastern part of the Fertile Crescent. Individuals with heavy European influence in their ancestry will show traces of this because all Europeans have mixed with people from Southwest Asia over tens of thousands of years.
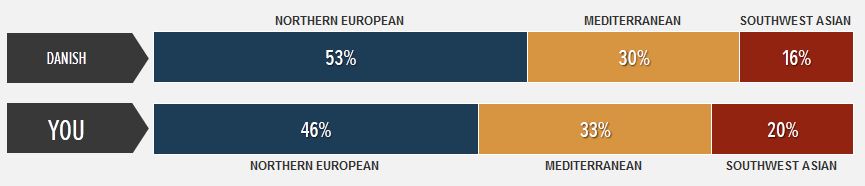
Danish
This reference population is based on samples collected from people living in Denmark. The dominant 53% Northern European component likely reflects the earliest settlers in Europe, hunter-gatherers who arrived there more than 35,000 years ago. The 30% Mediterranean and 16% Southwest Asian percentages arrived later, with the spread of agriculture from the Fertile Crescent in the Middle East over the past 10,000 years. As these early farmers moved into Europe, they spread their genetic patterns as well. Today, northern European populations retain the links to both earliest Europeans and these later migrants from the Middle East.
So despite the ancestors of my Scottish forebears living geographically on the edge of Europe (northern and eastern Scotland) they came originally and proportionately more from the Mediterranean and Southwest Asia than Northern Europe. It will be interesting to compare results from participants who have deep roots in western Britain and the Republic of Ireland.
The next section I’ll look at is that entitled YOUR STORY
In this section results are given for markers associated with your mitochondrial DNA (mtDNA) inherited solely from your mother and if you are a male the Y-Chromosome inherited from your father (women do not have a Y-Chromosome otherwise they would be men).
At this point it is worth remembering that Geno 2 is still in Beta. My Y-DNA terminal SNP was given as R-Z198.
As I mentioned earlier I have tested positive at Family Tree DNA for R-L165 which was discovered by Dr Jim Wilson on 2007 who called it S68. Jim found its presence in Sweden, Norway and the Orkneys, but despite 5 years having passing it is still rather rare and now predominated by two clusters from the Western Isles of Scotland; several single origin groups in both Scotland and England and more recently singletons from France, Spain and Germany. The position of R-L165 relative to its nearest clades can be seen here in the 2013 ISOGG Haplotree for haplogroup R.

According to the ISOGG haplotree, Z198 has not yet been placed, but the following information is available:
Z198 is potentially equivalent to L176.2/S179.2.
M167/SRY2627,
L165/S68, Z262 and L147.3 are all derived below R-Z198 as well as
L176.2/S179.2. Listed 13 September 2012.
Fortunately it is possible to download you raw data file from the Genographic Project as you can with Family Tree DNA and 23andMe (unlike AncestryDNA). To do this you go to Profile and then Expert Options. This is the same route to transfer your results into the Family Tree DNA database.
The placement of new SNPs on the Y-Chromosome Haplotree is not solely the domain of the testing companies or academics and the Genetic Genealogy community acting as citizen scientists have been at the fore front of this exciting area. As my result indicated a possible ambiguity in how Geno 2 was inferring my terminal SNP, I sought the views of the chaps on the R1b-P312 Haplogroup and Subclades Y DNA Yahoo group to whom I sent my raw data file. Thanks guys.
David Carlisle was able to compare my raw data with that from other Geno 2 testers who belong to the branch of haplogroup R1b closest to R-L165. As can be seen in the image below Z198 is shared with clade SRY2627 which is a known brother clade to L165. I have emailed the Genographic Project to highlight that my terminal SNP ought to be R-L165 and not R-Z198.

One
of the features of the participant pages I was keen to explore is called OUR STORY.
The
image below shows my Y-DNA matches. Participants are displayed on the circle with
those most closely related nearest to the middle of the circle, and those more
distantly related on the outside. It is possible to share your own family story
and those that have also done so have a larger circle which opens a dialogue
box when clicked. I am led to believe that at some stage it will be possible to
contact these matches.


As my R-L165 group is so small I am hoping that in the future this feature may result in a better understanding of its origin in Iberia and spread north into Europe as matches transfer into Family Tree DNA. Below are some personal stories in my group.


A
heat map for my specific haplogroup was not yet available and the general heat
map provided is still rather limited. I am not concerned about this as I know
that along with other features it will be updated in the months ahead.


Finally, my novel Hominid population percentages:

